
Scanning produces a much sharper, cleaner, higher-resolution and color-true image than photographing and using Photoshop to clean a chart. It’s also much faster: as a facilitator, I often come back from an event with dozens of flipcharts. The scanner can digitize them in a fraction of the time you need to Photoshop and clean an image. And in most cases, very little cleaning is necessary with a scanned chart beyond cropping and balancing levels.
Scanning is an advantage for graphic facilitators and recorders who use it. I’ve received feedback from my clients that including high-resolution scanning as standard was the selling point that won me the project.
Why scan and not Scanning produces a much sharper, cleaner, higher-resolution and color-true image than photographing and using Photoshop to clean a chart. It’s also much faster: as a facilitator, I often come back from an event with dozens of flipcharts. The scanner can digitize them in a fraction of the time you need to Photoshop and clean an image. And in most cases, very little cleaning is necessary with a scanned chart beyond cropping and balancing levels.
Scanning is an advantage for graphic facilitators and recorders who use it. I’ve received feedback from my clients that including high-resolution scanning as standard was the selling point that won me the project.
How scanning works
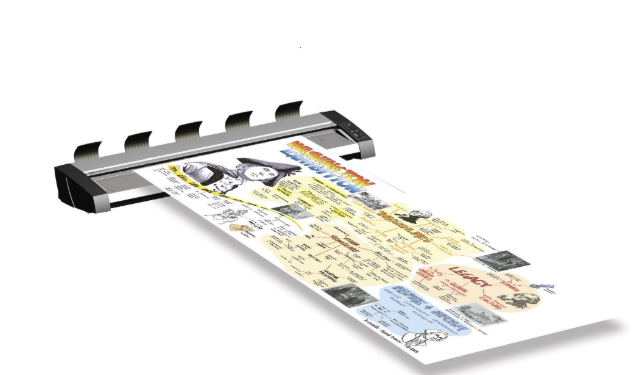
The scanner can handle charts that are up to 60” wide. I haven’t hit a maximum length yet, but it scanned a 40’ with no problem. It scans up to 1200 dpi… but that produces a ridiculously large file. A full size chart (48” x 120”) at 100 dpi will produce a JPEG file of around 5 megs. You can get an image in any format. If you have a preferred size or resolution, just let me know and I’ll do the math on the adjusted dimensions.
Scanning a chart is all about eliminating streaks on the image.
The chart slowly passes across a long strip of glass. If you've ever seen a receipt scanner, imagine a really big one of those and you've got it. If there’s a smudge on the glass, long streaks will appear on the scanned image. Here’s how to avoid smudges.
No tape or adhesive on the chart. This includes adhesive left by stickies that were posted then removed from the chart. If you used stickies, rub the paper with your hand where they were stuck to remove adhesive.
No dust or dirt. Be sure the surface you’re rolling the chart on is clean.
No chalk or heavy ink applications.
Tape down stickies with double-sided tape OR use full-back Super Stickies. Make sure no double-sided tape is visible.
Use silver-backed labels for corrections. They do a better job of adhering and blocking whatever was underneath. Cut the labels to fit, don't tear them: a ragged edge of a label will expose the glass to adhesive.
When using self-stick flipcharts, don't write on the smooth non-stick section at the top of the chart. It repels ink. Stack them oriented the same way they were on the flipchart pad, as if you were placing the charts back on the pad. Don't reverse their orientation when you stack them: they have to be peeled off and will leave adhesive residue on the paper.
Using rubber bands to hold your rolls close, not tape. Tape has to be picked off and it leaves adhesive.
The auto feeder is finicky. To avoid jamming and tearing your charts:
Roll the charts loosely. Too tight of a roll will curl the paper and jam the scanner.
Cut your paper as straight and square as possible. Uneven cuts will skew paper as it's fed through the scanner and wrinkle or damage the chart.
Label your charts with pencil, not pen or marker. Dark marks on the back of the chart will show through on the scanned image.
Leave a 2-3" margin between your art and the edge of paper. Some cropping will always occur.
Disclaimers
Flecks may show up. I was surprised to see flecks on the first few scans… then realized they were on my charts.
Streaks may show up despite our best efforts. This is usually due to glue (from stickies or tape) melting onto the lens. I’ll try to watch for those, but if your chart is full of stickies or tape, I won’t be able to get rid of all streaks. In extreme cases, I may decide there’s too many stickies or tape corrections for the scanner. I’m looking into buying a “carrier,” a large clear plastic sleeve that we can put charts into that will make stickies, chalk, and even paint easy to scan… but I don’t have one yet.
I’m not offering Photoshop touch up. I’ll color balance the scan as best I can, but after that it’s all yours to touch up. I can do a couple of demo videos on some of the finer points of chart touch up.